Malaysia
Climate Risk Map
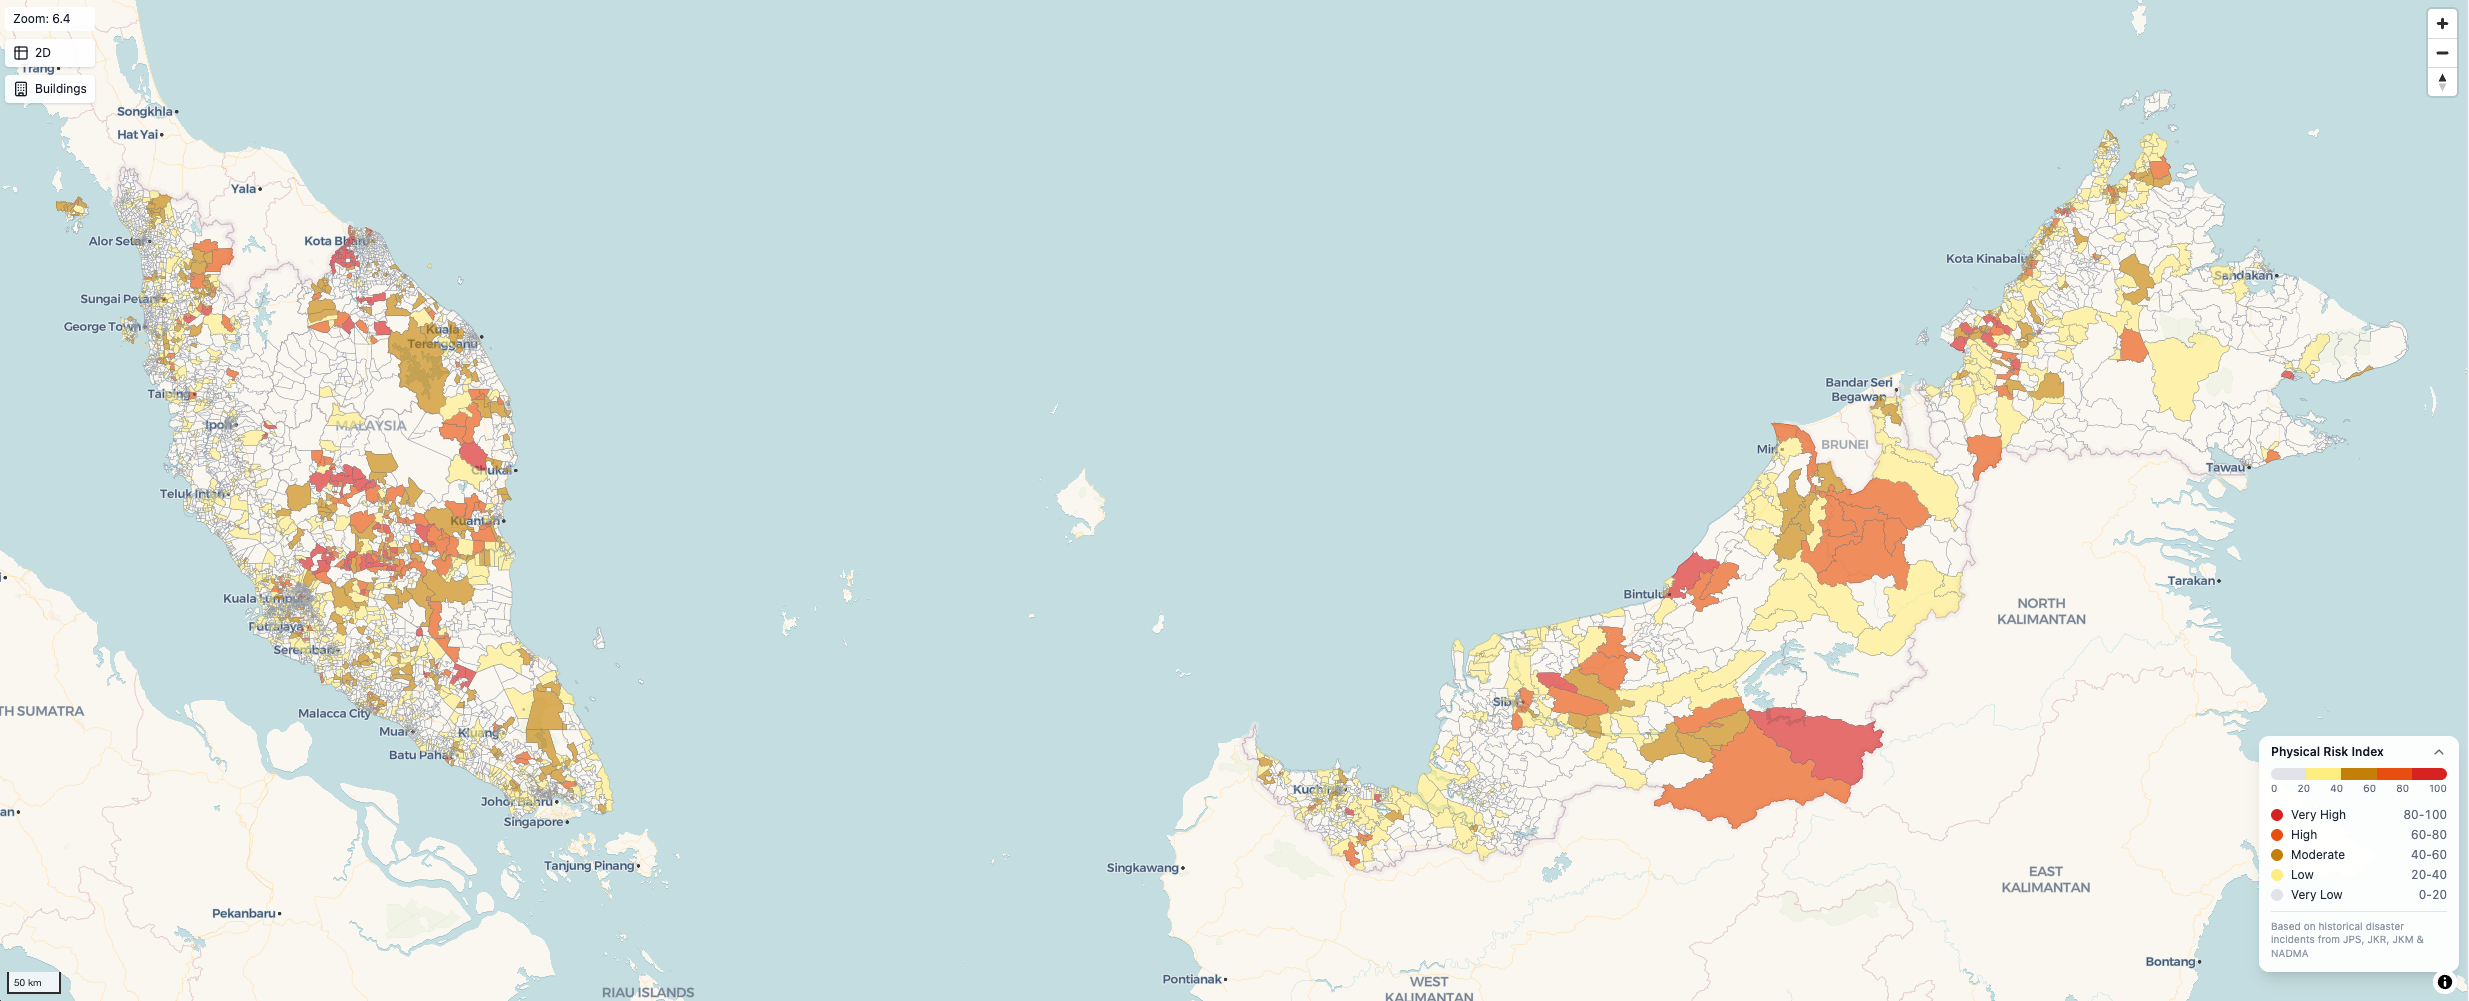
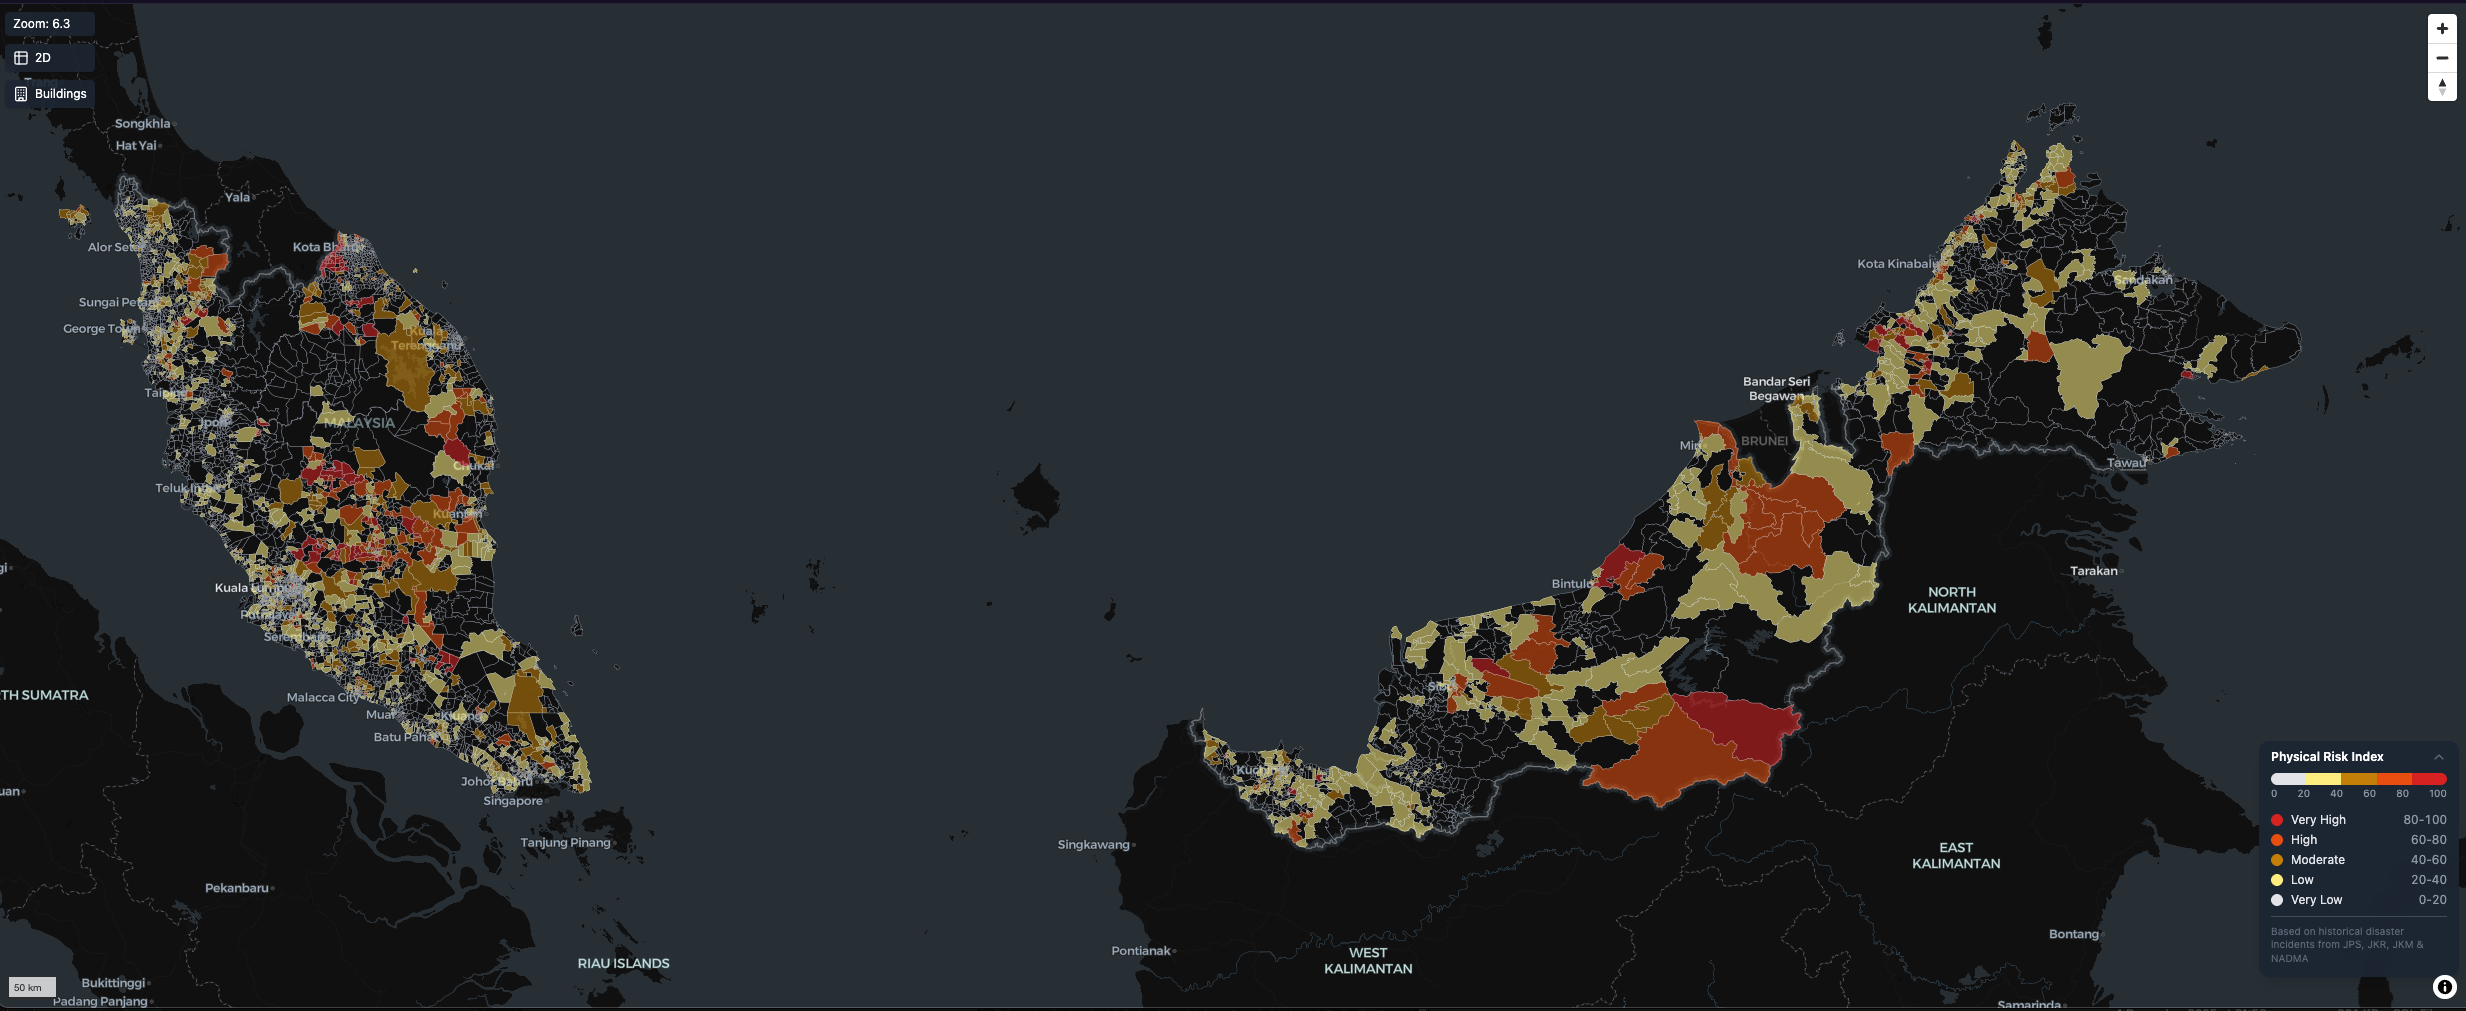
Explore physical risk data for 8,234+ localities across Malaysia. Identify flood and landslide vulnerabilities, track multi-year trends, and make data-driven decisions.
Explore Physical Risk Across Malaysia
Visualize risk indices for 8,200+ localities. Identify vulnerable areas, track year-over-year trends, and export data for your analysis.
Real-World Applications
The Physical Risk Index combines flood, landslide, and historical disaster data to provide a consistent view of local climate risk. Useful for planners, agencies, researchers, and organisations.
Disaster Preparedness
Emergency response planning
- Locate high-risk localities for floods and landslides
- Prioritise evacuation routes and early-warning coverage
- Review disaster events overlaid on risk data
Infrastructure Planning
Land-use & development
- Compare risk levels when siting roads, schools, housing
- Identify safer alternative sites for new projects
- Support zoning decisions with transparent indices
Community Resilience
Development programmes
- Target resilience programmes to exposed communities
- Combine risk scores with socio-economic data
- Share visual maps with local stakeholders
Research & Policy
Analysis & reporting
- Analyse multi-year risk trends at locality level
- Compare states or regions on a consistent scale
- Baseline data for climate policy studies
How the Index Works
A transparent methodology combining multiple data sources into a single, comparable risk score.
Data Sources
PRABN flood forecasting, JPS/JKR/JKM flood reports, NADMA disaster records, and JMG geological hazard databases.
Index Calculation
Separate flood and landslide indices combined into a Physical Risk Index (0–100), aggregated annually 2020–2025.
Trend Analysis
5-year rolling window, 3-year trend comparison (improving/stable/worsening), and year-on-year tracking.