Malaysia Climate Risk Map
Interactive physical risk map covering 8,234+ localities across Malaysia. Explore climate-related hazards, identify vulnerable areas, and track how risk changes over time.
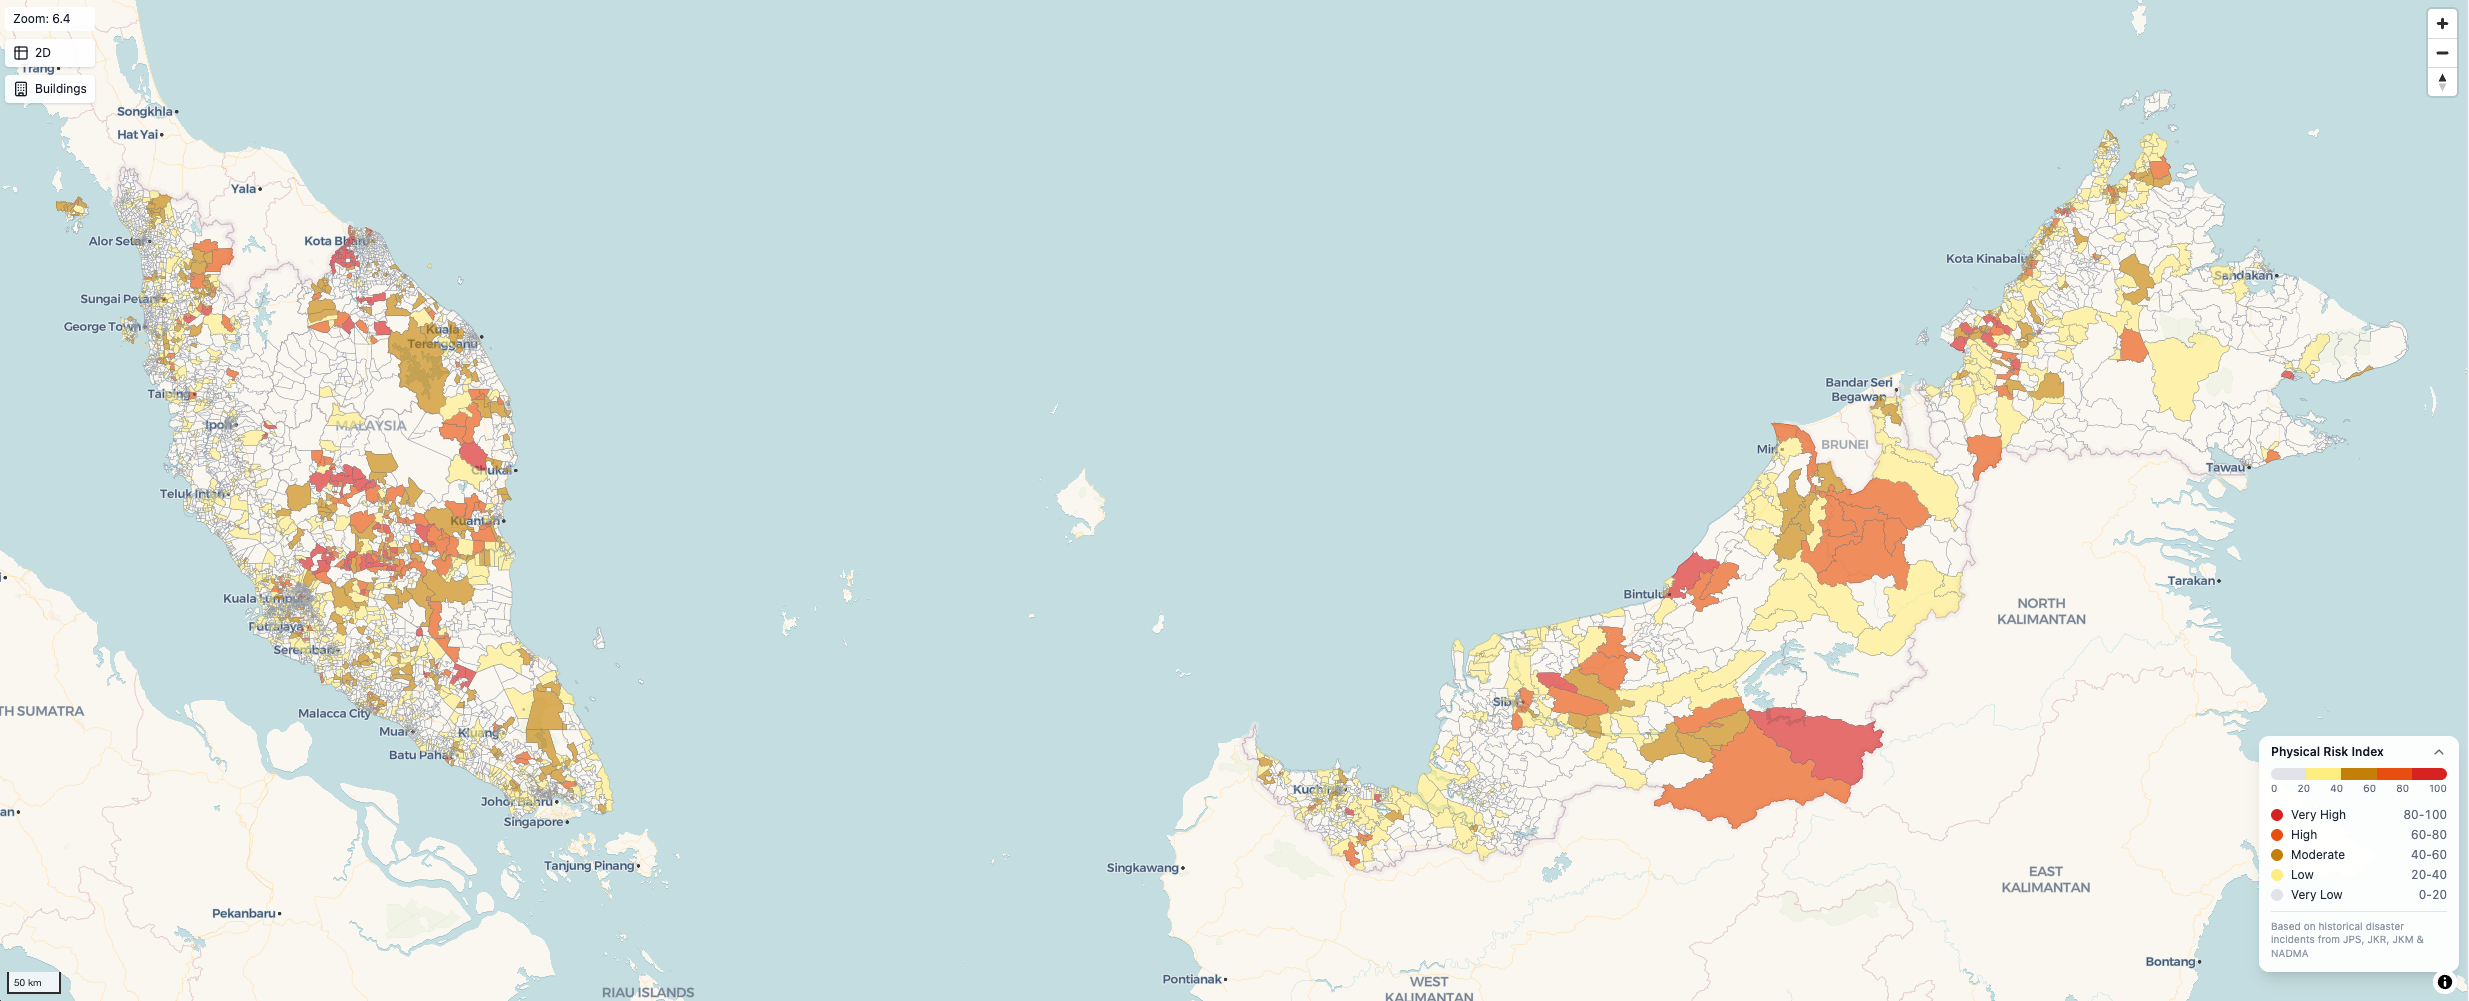
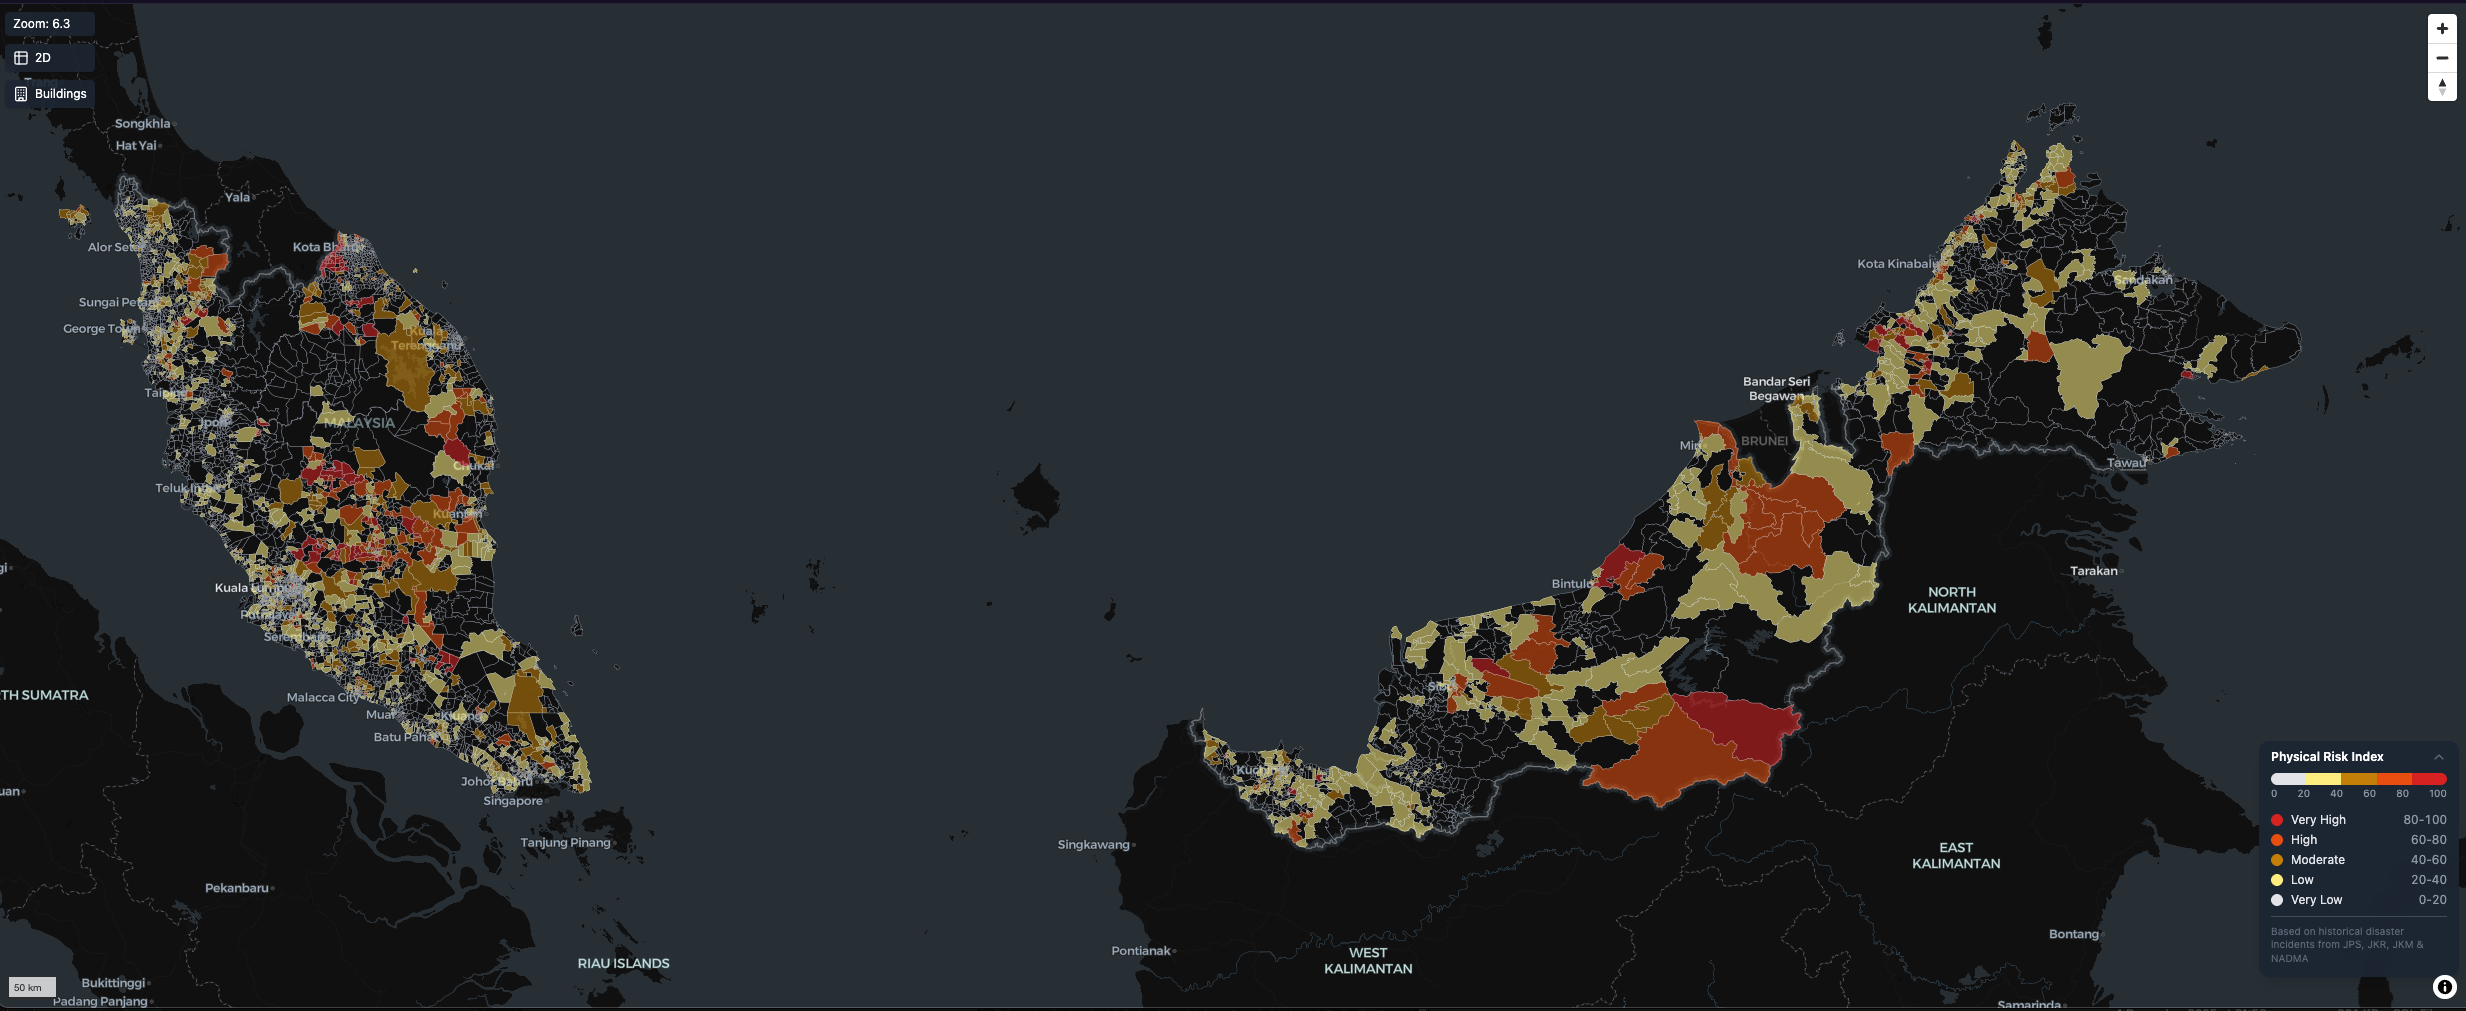
Explore Physical Risk Across Malaysia
Our interactive map visualizes physical risk indices for over 8,200 localities across Malaysia. Identify high-risk areas, track trends over time, and understand regional climate vulnerabilities.
How the Risk Map Is Used in Practice
Our Physical Risk Index combines flood, landslide and disaster history with climate indicators to provide a consistent view of local climate risk. The map is designed to be useful for planners, agencies, researchers and organisations working on resilience.
Disaster Preparedness & Response
- • Locate high-risk localities for floods and landslides
- • Prioritise evacuation routes, shelters and early-warning coverage
- • Review recent disaster events overlaid on the risk map
Infrastructure & Land-Use Planning
- • Compare risk levels across districts when planning roads, schools, clinics, housing or utilities
- • Identify safer alternative sites for new projects
- • Support zoning and development control decisions with a transparent index
Community & Development Programmes
- • Target resilience programmes toward the most exposed communities
- • Combine risk scores with socio-economic data to find vulnerable groups
- • Share visual maps with local stakeholders to support engagement
Research, Policy & Reporting
- • Analyse multi-year risk trends at locality level
- • Compare states or regions on a consistent scale
- • Use the map as a common baseline for climate policy studies
From Hazard Maps to Actionable Dashboards
The Risk Map is the foundation. On top of it, we provide two cockpit views that turn hazard information into portfolio impact and data-readiness insights.
Climate Impact Cockpit
- • Assess climate impact across assets, projects or locations
- • Combine exposure data with the Physical Risk Index and climate scenarios
- • Compare different pathways (e.g. higher vs lower emissions) and see how risk evolves over time
- • Ideal for organisations that want a portfolio-level view of climate exposure
Data Readiness Cockpit
- • Track which datasets are already available for your organisation
- • Map your data coverage against our climate data catalogue and risk map
- • Identify gaps for location data, hazard layers, or historical events
- • Monitor progress as new datasets are added or cleaned
How the Physical Risk Index Works
Data Sources
PRABN flood forecasting data, JPS, JKR, JKM flood incident reports, national disaster records (NADMA), landslide and geological hazard databases (JMG).
Index Calculation
Separate indices for flood and landslide, combined into a Physical Risk Index (0–100), then aggregated by year from 2020–2025.
Trend Analysis
5-year rolling window for index stability, 3-year trend comparison (improving, stable, worsening), and year-on-year change tracking.